
We measured 29 years of harvests across 41 counties. The money isn't in the good year — it's in the bad one
Almost everything sold in precision agriculture promises the same thing: more yield. A few percent. Every year.
We asked a different question. We took the official INSSE production figures for all 41 counties from 1997 to 2025 and put them beside the daily records of the ANM weather stations over the same period — 1.4 million station-days, from the 129 stations below 600 metres. Not to find out what a good year earns. To find out what a bad one costs.
The number surprised us too.
€485/ha. And it comes one year in four
In Romania’s median county, the worst maize year of the last 29 loses €485 per hectare against a normal one. On a 100-hectare farm that is €48,000. On 200 — nearly €97,000.
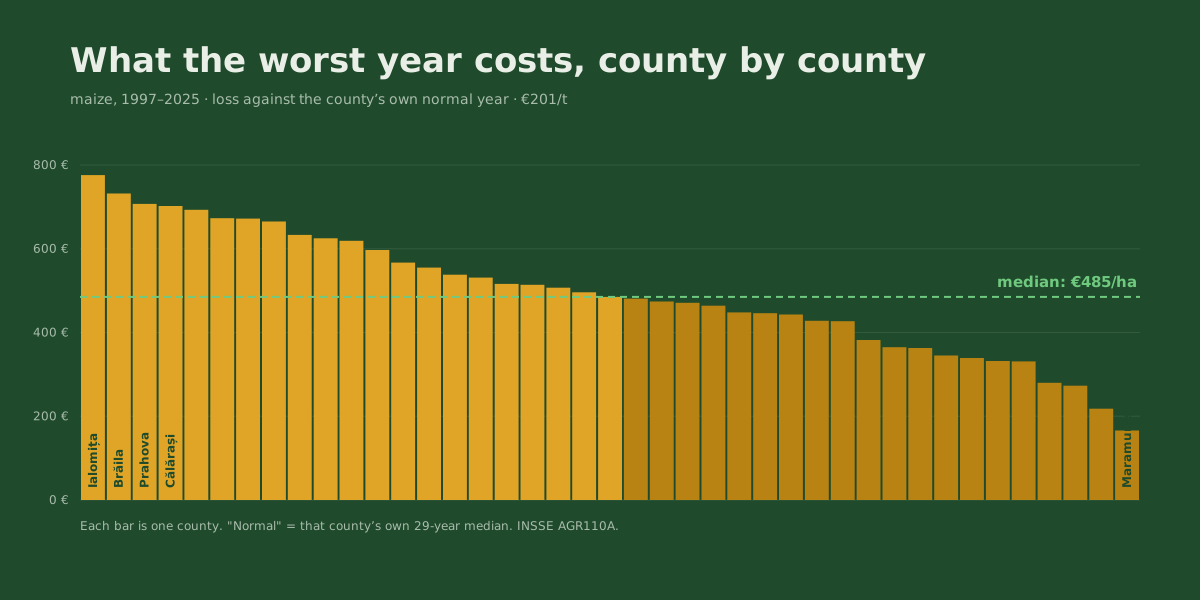
The chart matters for one reason in particular: €485 is not a carefully chosen extreme. It is the middle of the distribution. Even the least exposed county in the country — Maramureș — loses €166/ha in its worst year, and half of all counties lose more than €485.
This is not a simulation. These are years with names, and many farmers remember them:
| County | Normal year | The bad year | Loss |
|---|---|---|---|
| Ialomița | 4.29 t/ha | 0.42 t/ha (2007) | −90% |
| Prahova | 3.80 t/ha | 0.28 t/ha (2024) | −93% |
| Buzău | 3.59 t/ha | 0.25 t/ha (2022) | −93% |
| Călărași | 4.19 t/ha | 0.70 t/ha (2007) | −83% |
| Giurgiu | 3.80 t/ha | 0.35 t/ha (2000) | −91% |
Nor are they rare. Of 1,186 county-years analysed, 288 fell below 80% of that county’s own normal — one in four. Worse: we found 51 runs of two or more bad years back to back, the longest six years.
One bad year is survivable on reserves. Two in a row is what forecloses farms.
What water can defend — and exactly how much
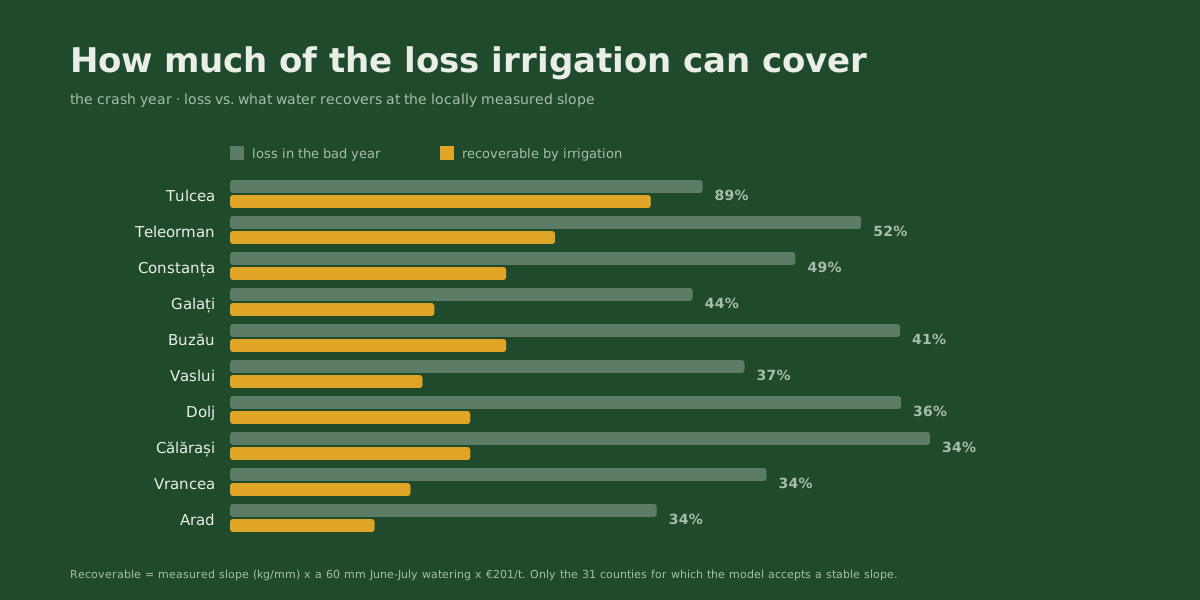
Here the data gets specific, because we were able to measure, county by county, what a millimetre of June–July water is worth in each place. Not a national average, but the real slope between each summer’s rain and each autumn’s harvest, over 29 years.
| County | Loss in a bad year | What irrigation recovers |
|---|---|---|
| Tulcea | €474/ha | €422 — 89% |
| Teleorman | €633/ha | €326 — 52% |
| Constanța | €567/ha | €277 — 49% |
| Călărași | €702/ha | €241 — 34% |
| Brăila | €732/ha | €157 — 21% |
The column that matters is the second one, and it is more modest than people expect: in Tulcea, the best county in the country, one well-placed 60 mm watering recovers 89% of a bad year’s loss. In Teleorman and Constanța, about half. Irrigation does not cancel a catastrophic year — it makes one survivable. That is the real value of water, and it is measured rather than assumed. For maize we have set out how the irrigation dose is decided in detail.
But look at the tail of the chart. Below Călărași the percentages fall away quickly — at Brăila water covers 21% of the loss, and below that, less. Irrigation is not a universal answer even in the south of the country. It depends on how tightly water limits the crop in that particular place, and that varies enormously between neighbouring counties.
Now be careful about what water does not solve.
2024 had more rain than 2025 — and a worse harvest
It is the pair of years everyone remembers, and it deserves a close look. In the summer of 2024 it rained more in June–July than in 2025: 115.7 mm against 96.2 mm. The maize harvest was nonetheless worse — 0.76 of the counties’ normal, against 0.93 in 2025 (the 2025 figure is provisional; INSSE usually revises it upward).
The first explanation that comes to mind is heat: 46 days above 32 °C and 19 days above 35 °C in 2024, against 31 and 11 in 2025. Maize pollen loses viability above 35 °C, and at 38 °C the plant stops shedding it at all — that happens on an irrigated field too.
But stopping there draws the wrong conclusion. Look at when it rained: the whole difference between the two years comes from June (60.8 mm in 2024 against 16.9 mm in 2025). In July — the month maize flowers and kernel number is decided — it reverses: 55 mm in 2024 against 79 mm in 2025. 2024 got its water a month too early and then baked through pollination. It was not a year with water and no luck; it was a year with the water in the wrong month.
We then checked whether the 2024–2025 pair says anything general, across all 29 years. The years below are ordered by June–July rain, driest to wettest:
| Year | June–July rain | of which July | Days >32 / >35 °C | Yield vs normal |
|---|---|---|---|---|
| 2022 | 81 mm | 43 | 28 / 8 | 0.95 |
| 2012 | 84 mm | 36 | 42 / 18 | 0.58 |
| 2007 | 91 mm | 44 | 29 / 13 | 0.45 |
| 2025 | 96 mm | 79 | 31 / 11 | 0.93 |
| 2024 | 116 mm | 55 | 46 / 19 | 0.76 |
| 2017 | 154 mm | 87 | 27 / 8 | 1.57 |
| 2021 | 155 mm | 63 | 23 / 6 | 1.44 |
Two things are immediately visible. Hot years with rain — 2017, 2021 — are record years. And hot years are almost without exception the dry years: over 29 years, days above 32 °C and June–July rain correlate −0.75. From county data we cannot separate the effect of heat from that of water, because nature sends them together — and where it sent them separately, water won.
What we can say honestly is something else: water does not cancel a heatwave, but it blunts it considerably. A transpiring crop runs several degrees below air temperature, and drought at flowering — not heat alone — is what turns a scorching week into an empty cob. Which is why anyone selling irrigation as the answer to every hard summer is selling half an answer: the other half is timing — water in July, not in June.
That is why our system tracks not only soil moisture but heatwaves, vapour-pressure deficit and severe thermal stress — three separate alarms, because they are three separate phenomena, even if they often arrive together. We have written at length about what happens to a crop at +38 °C.
If you don’t irrigate, the value is somewhere else
On a rain-fed farm we cannot add a single drop of water. It would be dishonest to pretend otherwise.
What can be done is to change decisions before the money is spent — and in a bad year that is the larger half of the loss:
- input triage — not spending on fertiliser and fungicide for a crop already lost. On 100 hectares, one fungicide pass you no longer make is several thousand euros that stay in the account;
- the re-sowing decision, taken inside the agronomic window rather than after it closes;
- the second crop, when the first failed early and there is still summer left — the system already knows, for each weather station, which catch crop finishes before frost;
- harvest timing against September rain, which in our data correlates negatively with yield (−0.38): rain at harvest damages, it does not help.
None of these adds yield. All of them cut spending on a harvest that is not coming anyway — and in the bad year, that is the saving that counts.
Where it isn’t worth it. We’ll say that too
Something you will rarely read in a sales piece: we also calculated where the system does not justify itself.
Our regional model refuses to put a price on water in 10 of 41 counties — Mureș, Sălaj, Sibiu, Cluj, Alba, Harghita, Bistrița-Năsăud, Satu Mare, Botoșani and Timiș. The reason: there the slope between summer rain and harvest is not stable across both halves of the series, meaning we have no evidence that water is what limits the crop.
And where the model does price water, the price sometimes says the same thing in other words: in Maramureș the measured value of irrigation water is €2 per hectare per year. We did not exclude the county — we measured it, and the number tells you by itself that there is no point.
The same applies to scale — but the useful figure here is not a hectare threshold. No official Romanian source publishes a standard build cost for irrigation, so any threshold would rest on an assumption. What can be said is what the water carries: €1,148/ha in Tulcea, €287/ha in the median county. Real quotes reported in the farming press start at €3,000/ha where the infrastructure exists and reach €6,000–7,000/ha where it does not. Not even the best county reaches half of the cheapest quote.
Those thresholds depend on what a scheme costs, so we also worked out the figure that does not: how much a scheme can afford to cost, per hectare, and still pay for itself at some size. In Tulcea the ceiling is €1,148/ha, in Constanța €1,013, in Teleorman €868. In the median Romanian county it is €287/ha — less than the sprinklers alone, before any pump or main line. Only 2 of the 31 counties can carry €1,000/ha.
A small farm is not an irrigation customer, in any county. Its value comes from decisions — the sowing window, early warning, the timing of field work — not from water.
We would rather tell you that now than meet about it in a year.
What this means for a farm
For a farm of 100–200 hectares, a subscription costs between €23 and €78 per hectare per year, depending on soil type and how many parcels are irrigated — the better the soil holds water, the fewer sensors the same area needs, and the lower the cost per hectare. Full pricing is here.
Put that figure beside the one at the top of this article: €485/ha, one year in four.
We do not promise that a sensor system stops a drought. Nothing stops a drought. We promise you will know what is happening at the root before it shows in the plant, through soil moisture sensors placed in the field — and that in a year like 2007, 2020, 2022 or 2024, you will make the decisions with data rather than with instinct.
That is not optimisation. It is insurance.
If you would like to see what these years would have meant on your own fields, get in touch — we will tell you, for your county and your crop, what the data shows and whether it is worth it.
About the data. Yields come from INSSE TEMPO, matrix AGR110A (41 counties plus the Municipality of Bucharest; the analysis uses the 41 counties, the only ones with a long enough maize series) and were independently checked against European Commission figures — they agree to within 0.1–0.8% for maize and wheat. Weather comes from ANM daily station records, 1996–2025, using the 129 stations below 600 m elevation — 1.4 million station-days. Rain and hot days in the 2024–2025 table are county means of each county’s stations; hot days are counted over the whole year, and “yield vs normal” is the 41-county mean of the year’s yield over the county’s own 29-year median — the same definition of normal used throughout the article. Irrigated areas come from INSSE AGR102A. The price used is €201/tonne, and electricity €0.14/kWh. The value of water is computed for a 60 mm June–July application — the dose our per-county library is derived and tested at, roughly one standard deviation of that window’s natural rainfall variation. Every county estimate passed a stability test across two halves of the series; the 10 that did not are not used. The per-hectare investment ceiling is the annual charge the measured margin can carry, at 15 years and a 5% cost of capital, and assumes no build price at all. We publish no hectare thresholds: they would require a build cost that no official Romanian source publishes. The quotes cited come from Ziarul Financiar, November 2022.