The agronomy engine: what works for your farm every hour, even when you don't open the app
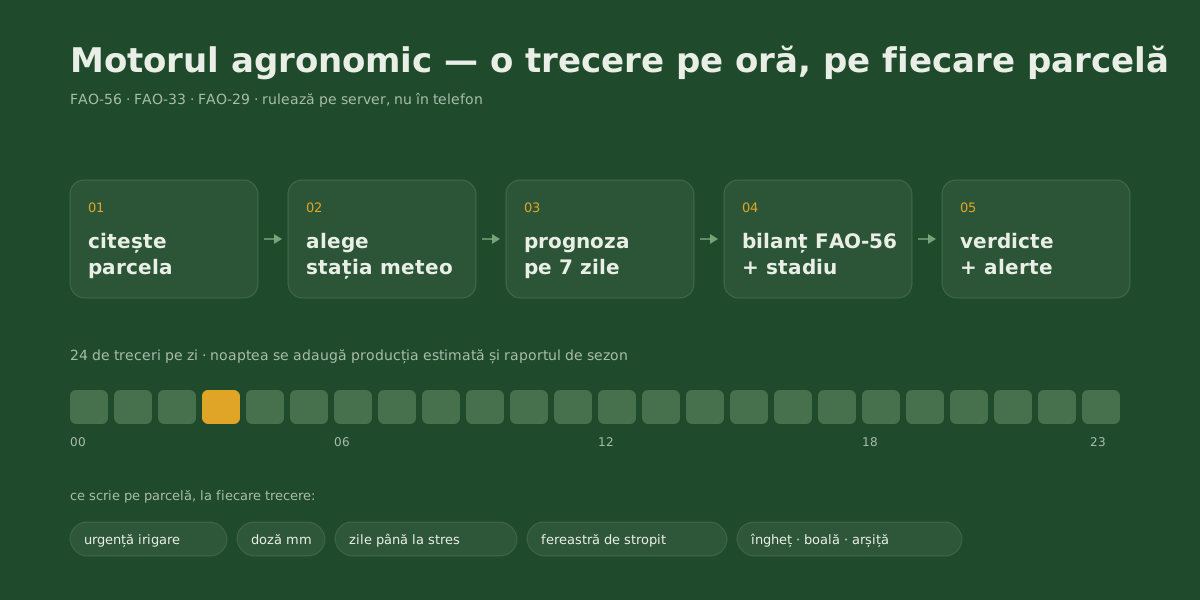
Most of the platform’s work happens when nobody is watching. At 3 a.m., with your phone on the nightstand and the app closed, a service on our server — we call it the agronomy engine — takes the parcels one by one and recalculates, for each of them, what is happening to the water, the crop and the risks of the coming days. An hour later it starts again.
If you want the wider picture first — what the system sees and what reaches your screen — start with what the app calculates for your farm. Here we go into the machine room: what the engine does on every pass, where the formulas come from, and where it admits its limits.
One full pass, every hour
On each run, the engine takes the parcels one at a time and does the following, in order:
- Reads the parcel. Crop, sowing date, soil texture, the polygon — so the real area in hectares — and the latest readings from its moisture and salinity sensors.
- Takes the driest zone, not the average. A parcel usually has several sensor groups. An average hides exactly the corner that goes into stress first, so the balance runs on the driest group. The verdict is conservative by construction.
- Chooses the weather station that describes the parcel. Its own station, the nearest one on the farm, a shared one — or, if there is none, the forecast. The engine records which source it used and how far away it sits, so you know how much to lean on the number.
- Recalculates the growth stage in heat units, not calendar days. The same maize, sown on the same date in two different years, reaches flowering on different days — and flowering is where the yield is decided. In autumn-sown crops winter accumulates almost no heat, so dormancy is weighted separately.
- Runs the root-zone water balance, following FAO-56. This is where the numbers you see on your phone come from: the irrigation need with the recommended dose in mm, the gross depth to pump (net dose divided by your system’s efficiency — drip loses ~10%, a hose-reel sprinkler ~25%), the days to drought — to warning and to stress — and the best day to irrigate, with forecast rain weighted by its probability.
- Issues the risk verdicts, each tied to the stage the crop is in right now. Frost, disease (a wet window and a temperature favourable to the pathogen — otherwise a cold rainy spell would raise alarms for nothing), heat, wind in tiers (gusts above 60 km/h, then above 90 km/h) and the spray window for the next 24–48 hours.
- Computes the yield loss from salinity, following FAO-29, on parcels that have a conductivity sensor.
- Writes everything back onto the parcel. From there the app, the alarms and the reports all read on — all from the same figures.
Overnight, a heavier pass is added: the yield estimate under FAO-33, with stress sensitivity scored by the stage the crop was in when the drought hit (in maize, a dry week at flowering costs several times more than the same week during vegetative growth), plus the season snapshot for the report and the whole-farm totals, valued at the current price per tonne.
The same formulas, in one place
A technical detail that matters more than it sounds: the engine on the server and the app on your phone do not each keep their own version of the maths. They use the same calculation modules. When we correct a formula, it is corrected everywhere at once — on screen, in the alarm, in the email and in the PDF report.
The constants aren’t ours to invent either. Crop coefficients (Kc), the allowable depletion fractions of the soil water reserve, the drought-sensitivity coefficients (Ky) and the salt-tolerance thresholds are transcribed from the primary sources: FAO-56 (Tables 12 and 22), FAO-33 (Table 12) and FAO-29. On every code change, nine automated checks compare the values in the program against the values in those tables — if someone changes a Kc by accident, no new version ships.
It calibrates itself against your station
A general model applied to your field is only the starting point. So on every pass, the engine compares its own numbers with what the farm’s station actually measured:
- Reference water use (ET₀). Once a day it compares the value computed under FAO-56 with the one measured by the station and keeps a slowly updated average bias. The result is a confidence level shown honestly: “warming up” while it has too few days, then low, medium or high.
- Gusts. Every anemometer has its own ratio between mean wind and gusts, depending on where it is mounted and how sheltered it is. The engine learns it from your station’s data and uses it for the wind warnings.
- Solar radiation inferred from the light sensor, calibrated against the theoretical clear sky for that location.
- The climate correction of the crop coefficient, from the minimum humidity and wind measured on the farm — not from textbook values.
- Rain-gauge health. The collector clogs with dust, insects and straw. When the reported rain doesn’t match the other signals, the system flags it instead of quietly computing a false balance.
What it refuses to say
The part of the engine we are happiest about is the part that deletes numbers.
If a parcel’s probes fail, if the crop changes, or if there isn’t enough history, the values that can no longer be computed are not frozen on screen — they are removed. Otherwise a parcel left without sensors at an estimated 22% loss would report 22% forever, with a fresh timestamp, so it would look current. An old number presented as current is more dangerous than no number at all.
The same logic runs throughout: when we don’t know for certain whether a parcel is irrigated, the model uses the rain-fed yield ceiling, the lower one — a cautious estimate is more useful than a flattering one. The yield estimate carries its declared margin of ±15–20%, and the conversion from bulk conductivity to the salinity of the soil solution is marked ±25–35% and deliberately kept away from any dose recommendation. What the system can’t know in general, we wrote about at length in the article on alarms.
And, most importantly: the forecast plans, the station decides. The engine uses the forecast to warn you early, but the “you can spray now” verdict comes from what is measured at the parcel.
Why this matters on the day something goes wrong
Because on that day, you don’t have the app open.
The fact that all the computation exists on the server, independent of your screen, is why the alarms reach you by phone and email without anyone having to go and check; why the season report carries the same figures you were looking at on your phone in July; and why the app opens instantly — it recomputes nothing, it just reads what was already computed.
The sensor measures. The agronomy engine turns the measurement into a decision — at 3 a.m., every hour, on every parcel.