What the app sees, calculates and does for your farm
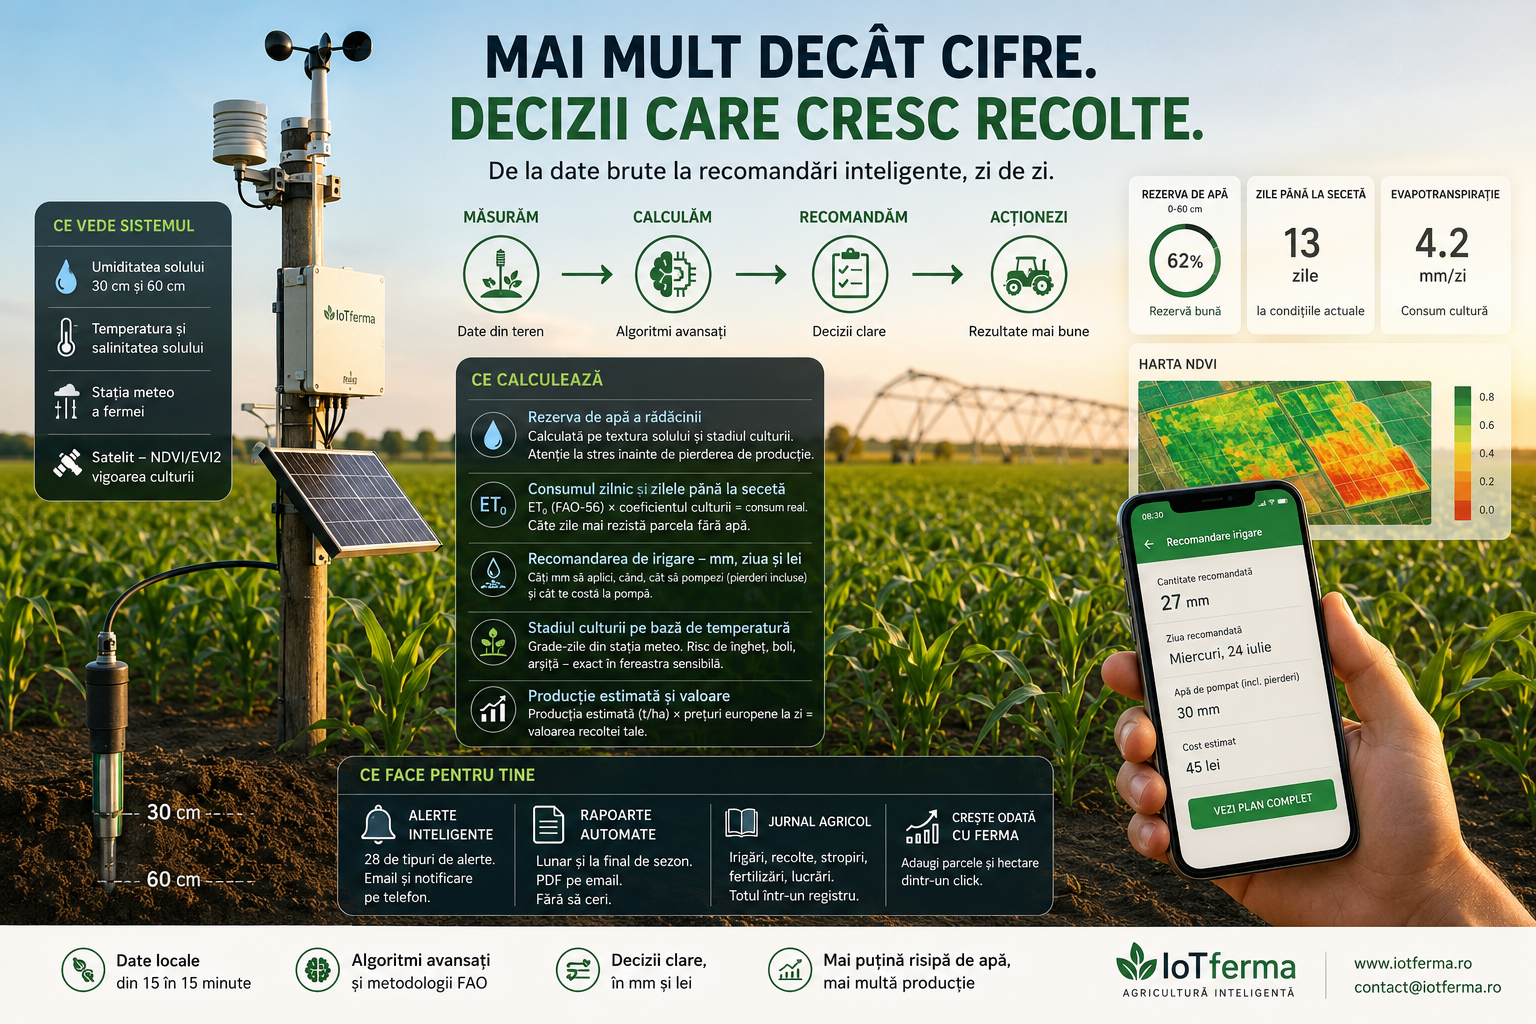
Many farmers who ask us about sensors think that’s what they’re buying: some numbers on a phone — moisture, temperature, done. The numbers are just raw material. The real work happens afterwards: from every measurement, the platform calculates things you can’t see with the naked eye and would otherwise guess. This article is the full tour: what the system sees, what it computes from what it sees, and what it concretely does for your farm, every day.
What it sees: the measurements
On every parcel, sensors report every 15 minutes:
- Soil moisture at 30 cm and, on the deep stations, at 60 cm — at root depth, not at the surface, where soil lies. (How many sensors you need.)
- Soil temperature and salinity — the sowing window and salinization risk.
- The farm’s own weather station — temperature, humidity, wind, rain, light. Not the city forecast: the weather on your field.
- Satellite — NDVI/EVI2 maps showing crop vigour zone by zone. (What NDVI is.)
Up to here, most monitoring systems look alike. The difference starts at the maths.
What it calculates: the math you don’t see
The root zone’s water reserve
A reading of “28%” means nothing on its own — on sand it’s plenty, on clay it’s already stress. The platform knows each parcel’s texture and computes the real plant-available water: how much your soil holds between field capacity and wilting, where the crop sits in that range right now, and the threshold below which yield loss begins. Same raw number, a different verdict on every soil — exactly as it should be.
Daily crop water use and days to drought
From the weather station, the platform computes reference evapotranspiration (ET₀) every hour using the standard FAO-56 method — the same one research institutes use — then multiplies it by your crop’s coefficient at its current growth stage. The result: how many millimetres of water your maize is drinking today, not maize “in general”. From reserve and consumption comes the number our customers watch all summer: days to drought — how long the parcel lasts without water under the forecast weather. For maize the number counts days to irrigation: how long, under the forecast weather, until the soil reaches the irrigation threshold of the stage the crop is in.
The irrigation recommendation: mm, the right day, and money
The planner (on every parcel, on both plans) — the irrigation scheduler that measures, not the one that merely opens a valve on a clock — doesn’t just say “irrigate”. It says:
- how many millimetres — enough to refill the reserve without pushing water below the roots;
- on which day — accounting for the 7-day rain forecast, weighted by its probability (a “maybe, 20%” shower next Thursday doesn’t postpone today’s irrigation) and passed through effective rainfall — because out of 5 mm of summer rain, the roots may see 3;
- what that means at the pump — the recommendation is water at the root; your irrigation system loses some on the way (drip ~10%, hose-reel sprinkler ~25%), and the platform shows the gross figure to pump;
- what it costs — set your water price in lei/m³ and every irrigation shows up in money, with the parcel’s season water bill totalled at the end.
For maize, the irrigation day no longer comes from the threshold where yield loss begins but from the University of Nebraska’s stage-by-stage strategy: irrigation is recommended at 70% of usable water used until about two weeks before tasselling, at 35% from then to the dough stage and at 60% after that, and once the soil holds enough to reach maturity, no more is recommended. Drought stress and the yield estimate stay on the FAO-56 stress line, and every other crop is still irrigated at that line.
Growth stages — by heat, not by calendar
Crops don’t grow by calendar; they grow by temperature. The platform accumulates growing degree days from the weather station and knows your maize is at flowering — the stage where 3 days of heat cost the most — even when a cool spring delayed it two weeks behind “normal”. Stage-aware risks follow: late frost on the sensitive stage, disease favoured by humidity and temperature exactly in its window, heat at grain filling.
Spray windows, yield estimate and value
From wind, forecast rain and the deltaT index, the platform marks the windows when spraying makes sense — and the days your product drifts to the neighbours. And from the whole season — water received, stress accumulated, stages passed — it estimates yield (t/ha) using FAO methodology — for maize, soybean and sunflower, heat included — and multiplies it by the regional silo price, so you see not just the harvest but its value.
What it does: alerts, reports, records
It alerts you — 33 alarm types, from frost and imminent drought to a low battery or a sensor that went silent (yes, the system watches its own sensors too). Email and phone push, with quiet hours at night and a daily digest if you prefer. We wrote separately about what the system alerts you to and when.
It writes your reports — monthly and at season’s end, a PDF report lands in your inbox with everything that happened on the parcel: water, stress, stages, yield. Without asking, without exporting anything.
It keeps your field journal — the irrigations you log and your harvests appear automatically in the parcel’s journal; you add sprayings, fertilizations and works from a short form, and at inspection time you have the register printed, per parcel and season. Fertiliser entries also build the fertiliser register, with nitrogen per hectare and yearly totals.
It draws up your maize nitrogen plan (Pro) — how many kg of nitrogen per hectare for the season, within the legal limit, and when to apply them, with fertiliser amounts; the doses still to come adjust to the chemical fertiliser recorded in the journal.
It grows with the farm — want to add parcels or hectares? One click in the app (“Request farm expansion”) and we call you with the revised offer. No bureaucracy.
Monitor or Pro?
Monitor shows you the soil and what to do on each parcel: the measurements, the water reserve, the safety alerts, the irrigation dose and day. Pro adds the whole farm and what is coming: water compared across parcels and water reports, forecast drought alarms, predictive stage-aware alerts, NDVI maps, season reports, the yield estimate and the maize nitrogen plan. You can start on Monitor and move to Pro when you want to compare parcels against each other and be warned from the forecast.
Want to see it on your farm? Browse the full feature list, size your setup in 2 minutes or write to contact@iotferma.ro — we handle the installation.