Romania has 3 million hectares equipped for irrigation. Last year it watered 605,000
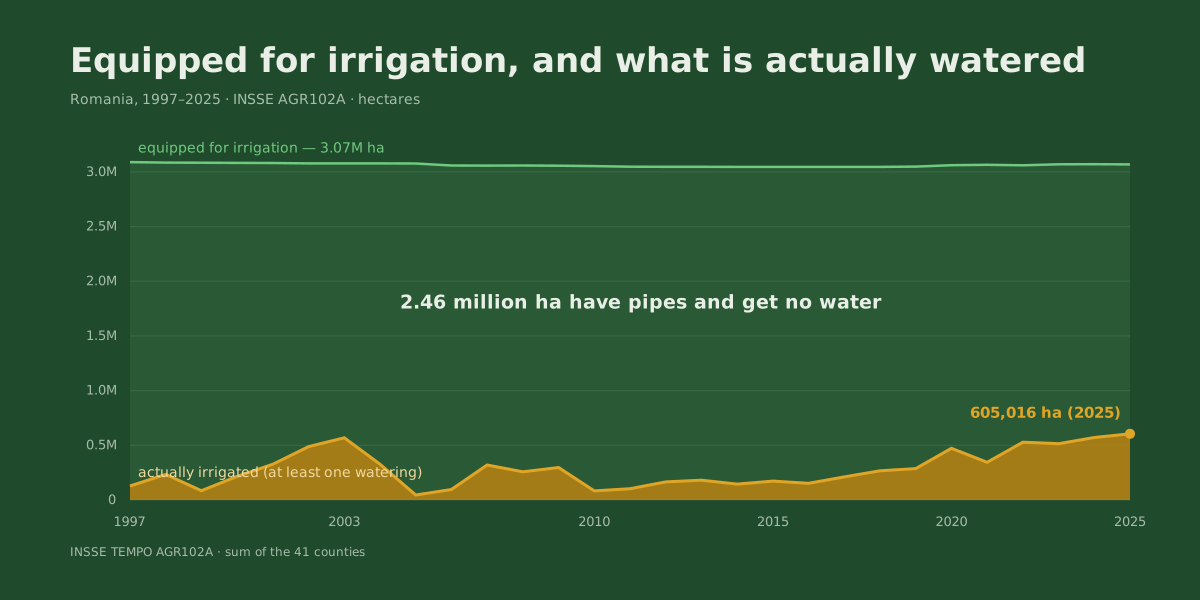
It is often said that Romania “has no irrigation”. The official figures say something else, and it is more interesting: Romania has 3.07 million hectares equipped. In 2025 it actually watered 605,000.
The rest — 2.46 million hectares — has pipes, canals and pumping stations, and receives no water.
First: what the two numbers actually measure
The difference between them is the whole story, so it is worth being precise about each.
“Equipped area” is the area that has infrastructure: a supply canal or pipe, a pumping station, an intake. It is an inventory figure. It says nothing about the condition of the machinery, and nothing about whether anyone actually starts the pump.
“Area actually irrigated” is defined by INSSE as the area that received at least one watering in that year. That is a very low bar — a hectare watered once, in August, after the maize had already lost its pollen, counts exactly the same as a hectare watered five times at the right moment.
Which means 605,000 hectares is a generous upper bound, not a measure of irrigation done properly. The area irrigated well is smaller. Hold on to that, because it changes the conclusion.
The U-curve: 2025 was a 29-year high
We took the complete INSSE series (matrix AGR102A, both columns) from 1997 to 2025. The story is not one of steady decline, as is usually assumed. It is collapse followed by recovery:
| Year | Equipped | Actually watered | Utilisation |
|---|---|---|---|
| 1997 | 3,089,065 ha | 127,790 ha | 4% |
| 2003 | 3,077,069 ha | 569,073 ha | 18% |
| 2005 | 3,076,912 ha | 45,719 ha | 1% |
| 2015 | 3,045,429 ha | 173,185 ha | 6% |
| 2020 | 3,060,852 ha | 472,928 ha | 15% |
| 2023 | 3,068,976 ha | 514,737 ha | 17% |
| 2024 | 3,070,520 ha | 570,994 ha | 19% |
| 2025 | 3,068,328 ha | 605,016 ha | 20% |
The area watered in 2025 is the highest of the 29 years in the series, thirteen times that of 2005 and 18% above 2023.
Two qualifications, because without them the figure misleads:
2005 is an exceptional minimum, not a typical year of its period — it was a wet year in which watering was simply not needed. Measuring the jump from there flatters it. The fair comparison is with 2003 (569,073 ha), and against that 2025 is what it really is: a return to the level of two decades ago, not a first.
The number of counties reporting changed over the series — 20 counties in 2005, all 41 in 2023–2025. So we redid the calculation on only the 14 counties present in all 29 years: the 2025/2005 ratio becomes 13.0 instead of 13.2, and 2025 remains the maximum. The trend is not a reporting artefact.
But utilisation is still 20%. Four in five equipped hectares sit idle.
Why they sit
Not for one reason, and none of them is fixed by an article:
- The break-up of land ownership after 1991 cut systems designed for state farms of thousands of hectares into plots of a few, with dozens of owners on one canal. A pumping station has a single switch; it cannot serve forty different decisions.
- The cost of energy, in the years when nothing was reimbursed, made water cost more than the crop it saved — especially at high lifts.
- Scrap-metal theft in the 2000s took pipes and motors out of service across whole systems. “Equipped” stays in the statistics; functional, it no longer was.
- Organising into water user associations (OUAI) went slowest exactly where fragmentation was worst. No association means no contract, and no contract means no preferential tariff.
The recovery of the last decade runs the same road backwards: associations formed, systems rehabilitated with public funds, and — from 2026 — a price of water that changes the arithmetic completely.
Where exactly they sit
| County | Equipped | Watered 2025 | Used |
|---|---|---|---|
| Constanța | 420,626 ha | 14,149 ha | 3% |
| Brăila | 357,239 ha | 230,612 ha | 65% |
| Călărași | 349,748 ha | 60,938 ha | 17% |
| Dolj | 299,246 ha | 28,874 ha | 10% |
| Teleorman | 231,395 ha | 5,329 ha | 2% |
| Ialomița | 203,148 ha | 65,555 ha | 32% |
| Olt | 184,585 ha | 15,727 ha | 9% |
| Mehedinți | 76,820 ha | 0 ha | 0% |
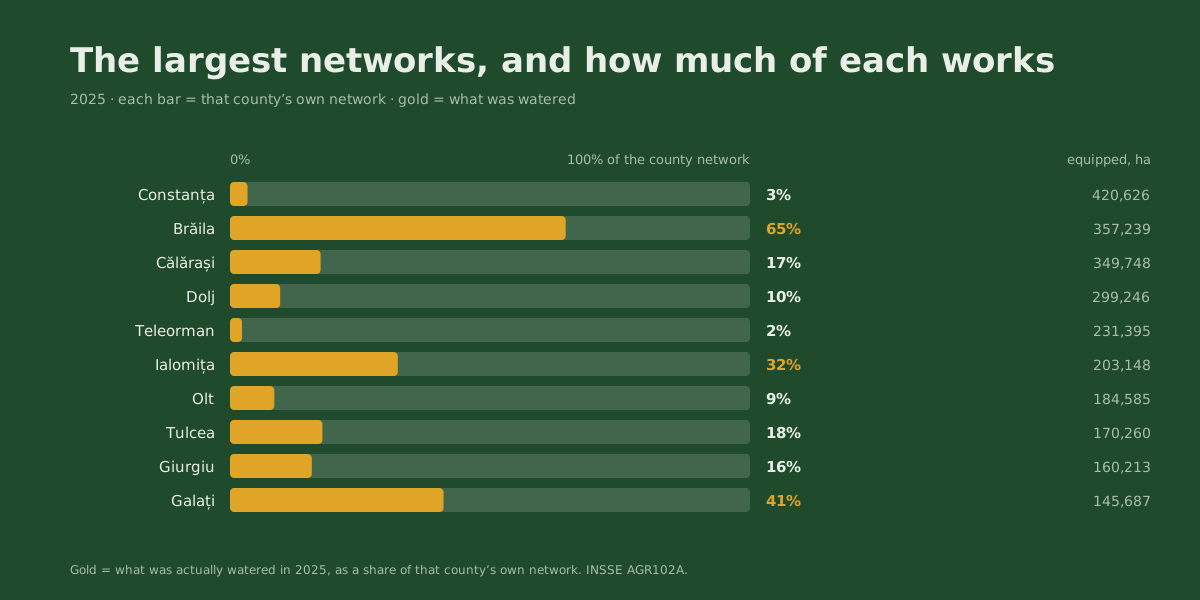
Brăila shows what a working system looks like: 65% of its network, in use. At the other end, Constanța has the largest network in the country and uses 3% of it — and in our 29-year analysis Constanța is the second county in Romania by the annual value of irrigation water (€105/ha/year, behind Tulcea), running short of water in 38% of years. The largest infrastructure in the country, sitting on one of the largest needs, almost untouched.
The Brăila–Constanța contrast is the most useful thing in the table, because the two counties are neighbours, share a climate and grow the same dominant crop. The difference is not agronomic. It is organisational.
What changed in 2026
The reason to re-read these figures now is that the price of water has changed.
- Water costs 2 lei per 1,000 cubic metres for farmers holding a contract with Apele Române. At a requirement of 1,150 m³/ha (that is, 115 mm), this comes to under 0.5 lei per hectare per season for the raw water. Effectively free.
- Up to 50% of the electricity used for irrigation is reimbursed. Through Government Decision 368/2026 the state made 125.4 million lei available to 443 beneficiaries — water user associations, companies and individual enterprises — for the 2025 season.
What does that mean per hectare, calculated from physics rather than from a brochure?
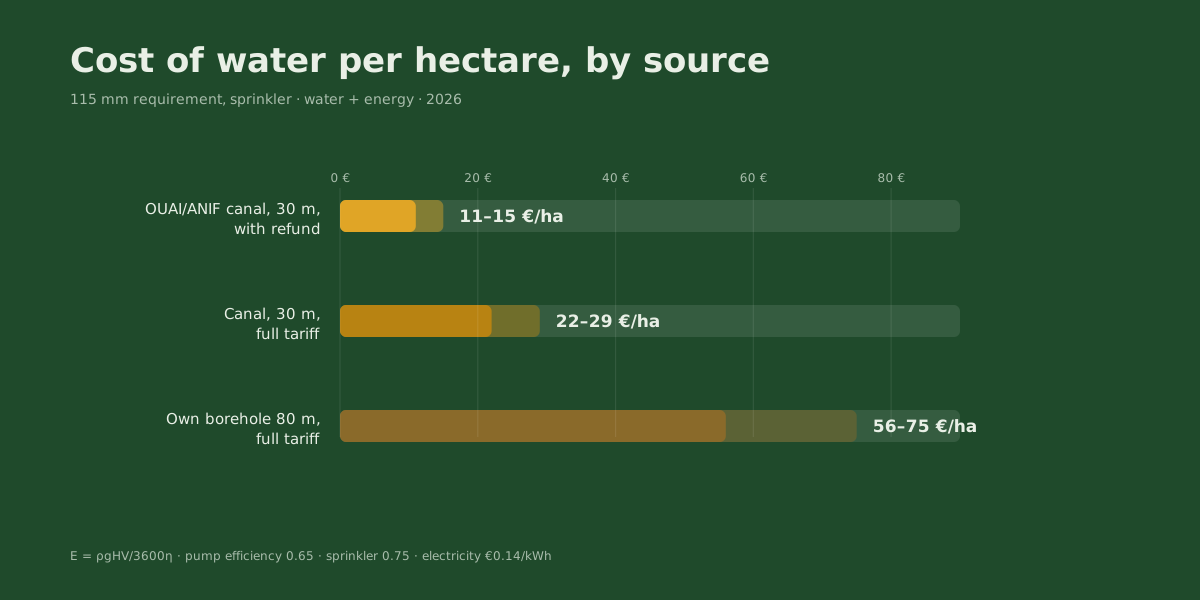
The difference between the first row and the last is almost entirely lift height. From an OUAI canal you raise the water 30 metres; from an 80-metre borehole you raise it nearly three times as far, and the energy scales with it. Which is why access to a working association is worth more, in money, than any equipment you could buy.
A farmer inside a water users’ association now pays, for water and energy, about the price of a restaurant meal per hectare. Water is no longer the barrier.
So what is the barrier?
Two things, and both are arithmetic rather than policy.
First: size
An irrigation scheme means a pumping station, a main line and a control system — and those cost the same whether they serve 50 hectares or 200. The cost of water falls per hectare; the fixed cost does not.
We looked for an official Romanian build cost for irrigation. There isn’t one. Neither AFIR nor the rural development programme publishes a standard cost per hectare for irrigation investment — the applicant guides contain no “standard cost” at all, and AFIR’s own price database explicitly excludes irrigation. So we do not publish a hectare threshold either: it would be a figure built on a cost assumption we cannot support with anything.
What can be said without any assumption about build cost is the ceiling below. Put it beside real quotes. In November 2022 Ziarul Financiar quoted the CEO of Holde Agri Invest: the investment “starts at €3,000 per hectare in areas where the national irrigation infrastructure exists and reaches €6,000–7,000 per hectare” where it does not — plus €100,000 for the electricity connection alone on a 100-hectare block.
Not even the best county in the country reaches half of the cheapest real quote. Tulcea carries €1,148/ha; the median county, €287/ha. That is the conclusion, and it rests on no figure we invented.
But that threshold depends on what a scheme costs — and that is the number we know least well. So we inverted the calculation. Instead of assuming a cost and announcing a verdict, we worked out how much a scheme can afford to cost, per hectare, and still pay for itself at some size. This ceiling rests on no assumption about what a scheme costs — precisely the number we do not know. It falls out of the measured value of water in that county. It does unavoidably assume a maize price (€201/tonne) and an electricity price (€0.14/kWh); we state both so you can move them.
| County | What a scheme can cost, per hectare |
|---|---|
| Tulcea | €1,148/ha |
| Constanța | €1,013/ha |
| Teleorman | €868/ha |
| Giurgiu | €754/ha |
| Călărași | €702/ha |
| Galați | €650/ha |
| Dolj | €526/ha |
| Brăila | €474/ha |
| the median county | €287/ha |
Read it like this: if you have a quote for an irrigation scheme, compare it against your county’s ceiling. Above the ceiling, the investment never returns at any area — not at 500 hectares, not at 5,000.
Of the 31 counties with a measured value, only 2 can carry €1,000/ha and only 9 can carry €500/ha. In the median Romanian county the ceiling is €287 per hectare — less than the sprinklers alone, before any pump or main line. The conclusion does not move with prices: for most of the country, a new irrigation scheme does not pay for itself out of maize.
That does not mean watering is pointless where a working association already exists — there the fixed cost is already paid, and the arithmetic above is for someone building from scratch. It means new investment in irrigation is a niche decision, not a general one. Below the threshold, the value does not come from water — it comes from decisions: the sowing window, early warning, the timing of field work.
Second: timing
This is the part nobody subsidises, and the most important thing in the article.
Across 29 years of data, water falling outside the June–July window has almost no effect on the maize harvest. In August the measured effect is close to zero, and September rain correlates negatively with yield — at harvest, water damages.
Put that beside the definition at the top. The statistic counts a hectare as “irrigated” after a single watering, whenever it happens. The plant’s physiology counts only the waterings inside the window that matters. These are not the same thing, and the gap between them is exactly where the money is lost: a round moved outside the window is a round paid for and wasted, however cheap the water was.
The state has made water cheap. Nobody can make the right moment cheap — that has to be measured, at the root, in your own field.
What it means if you have the network and don’t use it
If you farm in one of the counties above, with pipes in the ground and the pumps switched off, the 2026 arithmetic no longer resembles 2015:
- Water is nearly free — under 0.5 lei/ha for the raw water, with a contract.
- Half the energy is refunded, if you are in an association that applies.
- The measured value of one well-placed 60 mm watering covers 89% of a bad year’s loss in Tulcea, 52% in Teleorman and 49% in Constanța — and a bad year costs €485/ha in the median county. Water helps a great deal; it does not cover everything.
What remains to be solved is knowing when to start the pump. And that requires seeing the water in the soil at root depth, not at the surface — because the surface dries and wets with every shower, while the plant drinks at 30 and 60 centimetres.
We have written separately about what a bad year actually costs a farm — €485/ha in the median county, one year in four. If you want to see the equipment, we have pages on field irrigation systems, controllers and hose reels, and the water cost calculator gives you the figure for your own source.
Or get in touch and we will tell you, for your county, what 29 harvests show — including if the answer is that it is not worth it.
About the data. Equipped and actually irrigated areas come from INSSE TEMPO matrix AGR102A, both series, 1997–2025 (“agricultural area actually irrigated with at least one watering”), summed over the 41 counties. The check on the 14 counties present in every year is described above. Energy costs are calculated from E = ρgHV / 3600η at a pump efficiency of 0.65 and sprinkler efficiency of 0.75, with electricity at €0.14/kWh. The per-county value of water comes from regressing county maize yield on June–July rainfall, 1997–2025, with a stability test across two halves of the series. The per-hectare investment ceiling is the annual charge the measured margin can carry (revenue from water less energy and tariff), at 15 years and a 5% cost of capital. We publish no hectare thresholds, because they would require a build cost that no official Romanian source publishes. The ceilings do not depend on that cost. They do depend on asset life and cost of capital: at 15 years and 5% the median ceiling is €287/ha, at 25 years it rises to €390/ha and at 10 years it falls to €213/ha — in every variant far below any real quote. The value of water and the ceilings are computed for a 60 mm June–July application — the dose our per-county library is derived and tested at. Water tariff and reimbursement scheme: ANIF and Government Decision 368/2026.