What NDVI is and how to use it together with soil sensors
Soil sensors tell you what is happening below the ground, at the roots. NDVI shows you what is happening above, in the green canopy of the crop — as seen from a satellite. Together, the two give you a picture that neither can provide on its own. Here is what NDVI is, what you can see with it, and why it matters that it works hand in hand with the sensors.
What NDVI is, in brief
NDVI (Normalized Difference Vegetation Index) is an index calculated from satellite imagery — in our case, from the Sentinel-2 satellites of the European Copernicus programme. In short: healthy plants reflect strongly in the near-infrared and absorb red light; NDVI compares the two and produces a value for vegetation vigour.
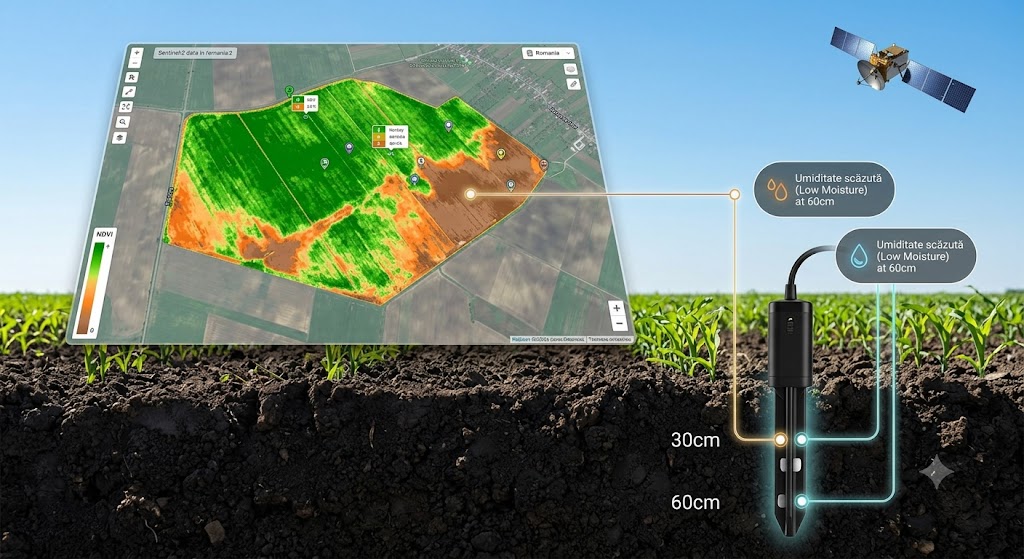
On the map you see it as a range of colours: brown where there is bare soil or sparse vegetation, yellow/orange where the crop is thin or stressed, and green where the canopy is dense and vigorous. At a glance you can see how each field is doing — and each zone within the field.
What you can see with it
NDVI captures things that, from the ground or from the cab, you would only notice much later:
- Areas of stress before they are visible to the eye — a patch that “fades” on the map signals a problem a good few days before it shows up in the field.
- Uneven emergence or gaps in the crop.
- Patterns — a corner that is always lagging behind, a strip of land that dries out first.
- The course of the season — how the canopy develops from one image to the next.
Why it is more powerful together with soil sensors
This is the key. NDVI and soil sensors answer different questions:
- NDVI shows you that there is a problem and where — a symptom, seen from above.
- Soil moisture tells you why and what to do — the cause and the decision, measured at the roots.
A concrete example: NDVI shows a paler patch in one corner of a field. You look at the sensor in that zone — it confirms the soil is dry. The FAO-56 irrigation plan tells you how much to apply. Problem found, cause confirmed, decision made.
Or the other way round: NDVI shows a weak zone, but the moisture reading is within the normal range. Then you know water is not to blame — and you look elsewhere (nutrition, disease, pests). In both cases, NDVI without sensors would just be an observation; sensors without NDVI would just be a single point. Together they close the loop.
How often it updates
It is important to have the right expectations. Sentinel-2 passes over the same area roughly every 2–3 days at the latitude of Romania — but the image is only useful where the sky is clear. Clouds are the real limit, not the orbit: in practice, a clear image appears roughly once every 5–10 days, less often during cloudy spells.
So NDVI is a trend layer — you use it to catch developments and problem zones early, not as a real-time measurement. For the “right now”, soil sensors transmit continuously; NDVI gives you the overall context, from above.
NDVI and EVI2 — two indices, complementary
NDVI is the classic, but it has a known limitation: over very dense vegetation it “saturates” (the values cluster at the top and no longer distinguish well between good and very good), and over partly bare soil it is influenced by reflection from the ground. That is why the platform also shows you EVI2 (Enhanced Vegetation Index 2), likewise calculated from Sentinel-2 imagery.
EVI2 corrects exactly these two points: it stays sensitive where NDVI saturates (vigorous crops, at the height of the season) and is less influenced by the soil between the rows. In short:
- NDVI — a quick reference, good for emergence and for thin or stressed zones.
- EVI2 — more reliable over a dense canopy and at the height of the season, when NDVI can no longer tell the difference.
You switch between them on the same map, over the same fields. Where the two disagree, you get an extra signal: usually it is bare soil or a very dense crop — exactly the situations in which a single index could mislead you.
Available on the Pro plan
The satellite NDVI and EVI2 maps are part of the Pro plan, alongside the FAO-56 irrigation planner and the predictive alarms — that is, part of the decision layer of the platform, on top of the basic monitoring.